Understanding Your Carbon Footprint and Forest Carbon Sequestration
April 12, 2019
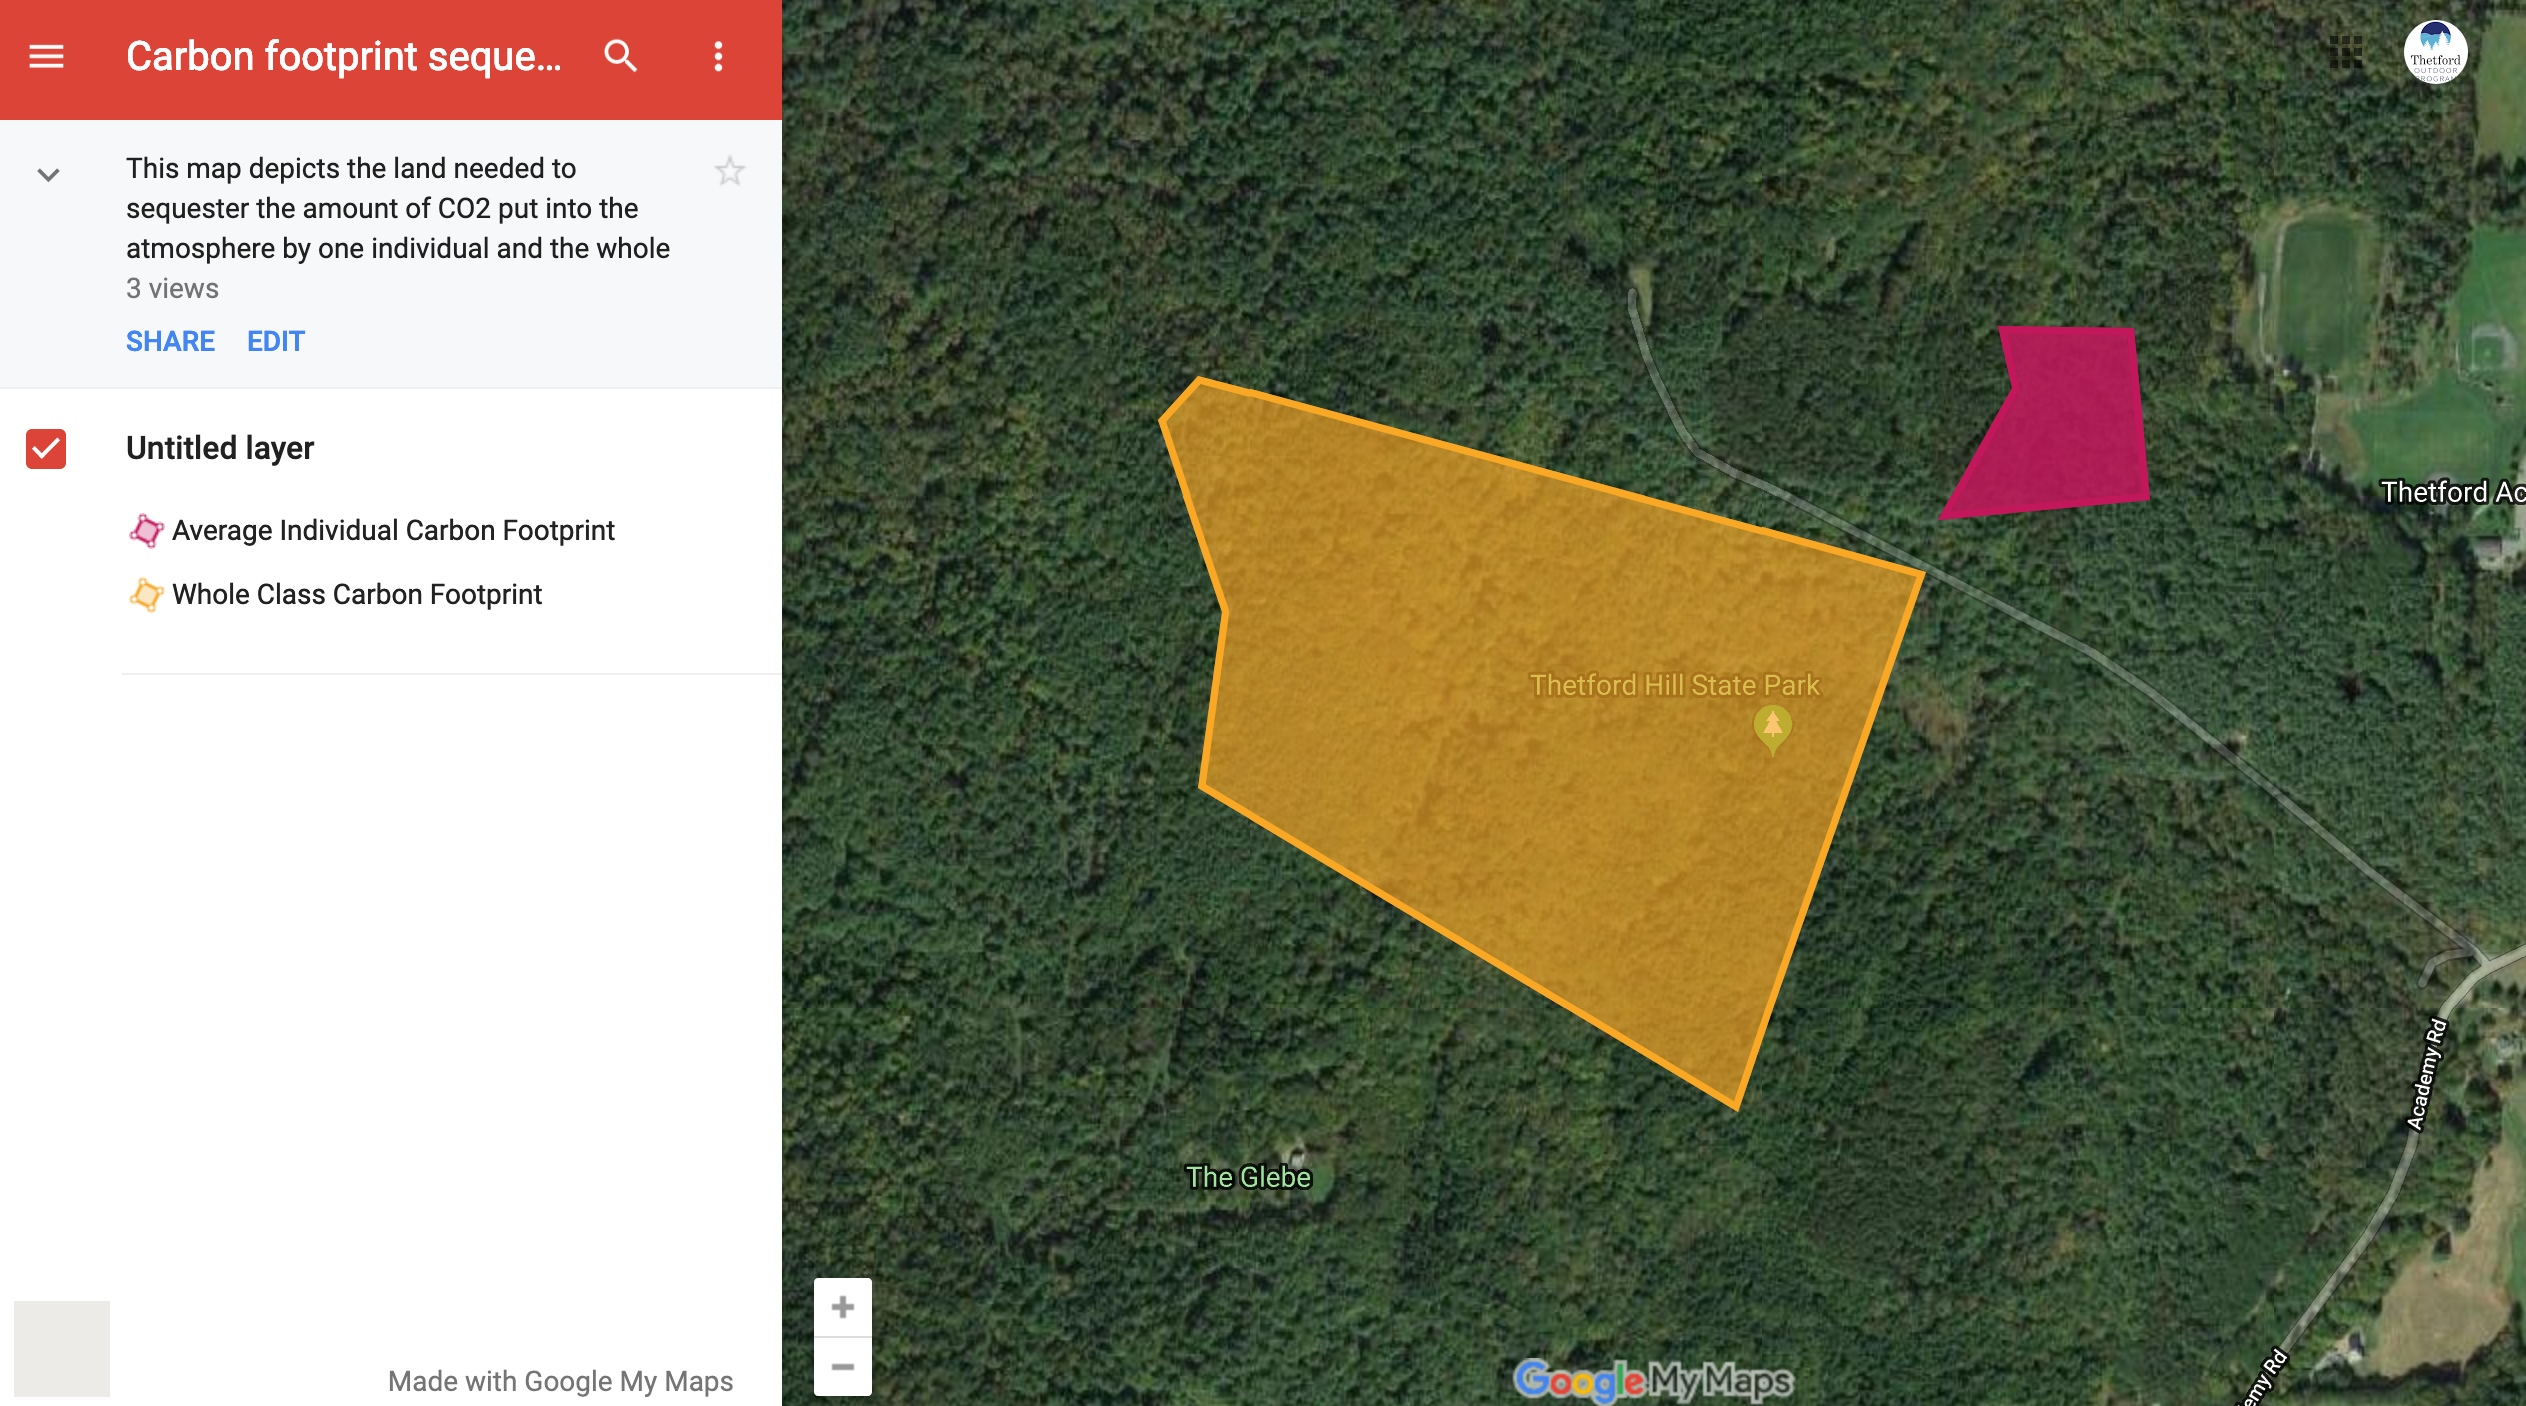
Follow the link below to see the Carbon Footprint Map
Students in the Environmental Studies and outdoor education course have been working on understanding their carbon footprint and how forests can reduces atmospheric CO2.
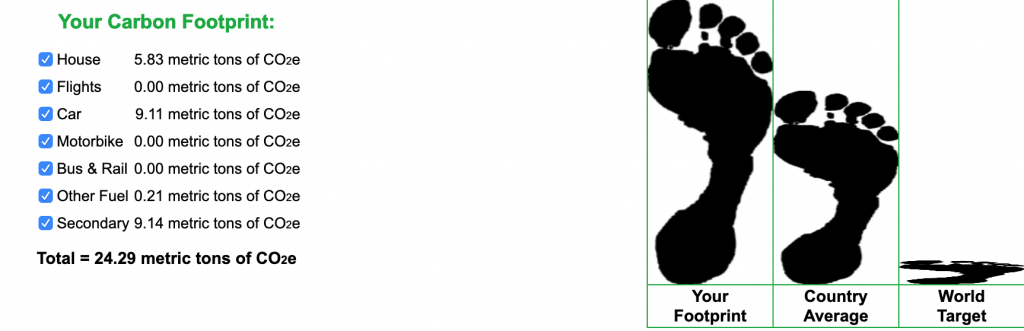
Each student started with calculating their carbon footprint for one year. To do this they needed to know their electricity and heating consumption, any flights they have taken, model of car they have and miles driven, other forms of transportation, food and drink products they consume and a variety of other criteria. This then gave each student a total carbon footprint. The average footprint of students in the class is about 25 metric tons of CO2. In comparison, the average footprint for people in United States is 16.49 metric tons.
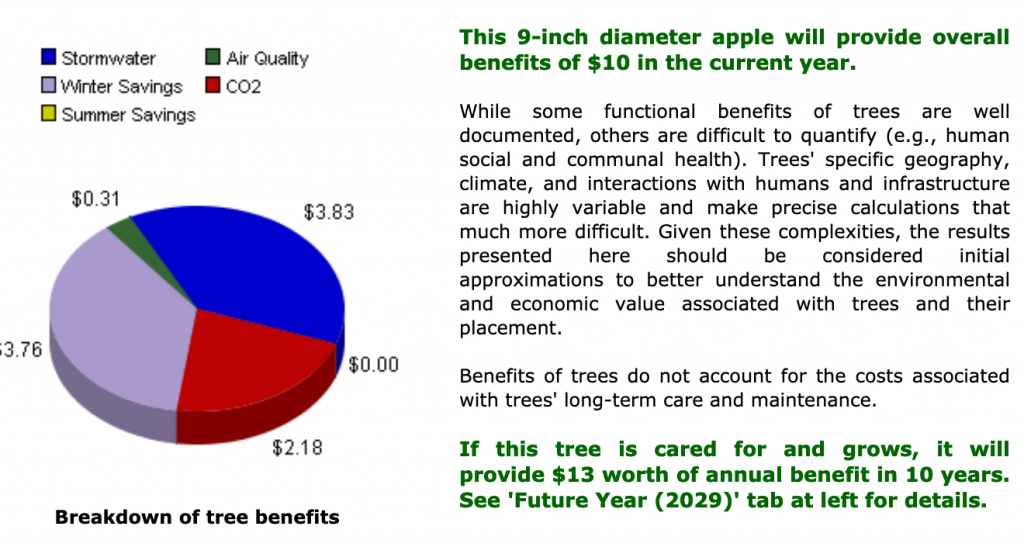
Then the class set out to discover the benefits of trees and how they take in CO2 and can sequester Carbon. This started with picking one tree near everyone’s home and calculating its benefits using I-Tree Design software. We found that the average yearly benefit of one of our trees is about $84 a year in total savings and it would take an average of about 350 of these trees to sequester the amount of CO2 one individual in the class produces in a year.
The next step was to calculate the amount of CO2 a forest sequesters in a year. It was noted that the data collection methods do have errors. For example tree mortality is not taken into consideration. In multiple one acre test plots average diameter for each tree species in the plot was measured, each tree in the plot was tallied, and I-Tree design was used to calculate how much each tree will reduce atmospheric carbon dioxide in a year. Then by combining the calculations the class was able to find the average amount of CO2 sequestered by one acre of the State Forest.
The final step was for the students to create an online map using Google My Maps to depict an area of of land in the state forest that reduces atmospheric CO2 by the same amount as their carbon footprint and for the carbon footprint for the whole class. This gave the students a visual depiction of their carbon footprint on a piece of land that they know well.